Home > Power BI
Power BI Program
Course Description

Introduction to Power Bi

Real-Life PowerBI Project

Job Readiness Program

Lifetiime access to study material
Skills Covered

Data Cleaning & Profiling

Visualisation

Data Warehousing

DAX

Publishing & Sharing

Data Refresh & Security
Power BI is a powerful business intelligence tool developed by Microsoft that allows you to create interactive reports and dashboards for data analysis. If you want to embed Power BI content in a website, you can do so using the Power BI Embedded service or by using the Power BI Publish to web feature. Here’s how you can use each method
Power BI is a business intelligence tool developed by Microsoft. It allows users to connect to various data sources, create interactive reports, and gain insights from their data. With Power BI, you can visualize data using charts, graphs, and tables, making it easier to understand and analyze complex information
Course detail
Power BI Course Curriculum
In the first module of this Power BI course, you will learn the basics of Power BI
1.1 Introduction to business intelligence (BI)
1.2 Stages of business intelligence (BI)
1.3 Use cases of BI
1.4 Various BI tools
1.5 Overview of data warehouse and concepts
1.6 Introduction to Power BI
1.7 Why Power BI?
1.8 Power BI components
1.9 Power BI pricing structure
1.10 Building blocks of Power BI
1.11 Architecture of Power BI
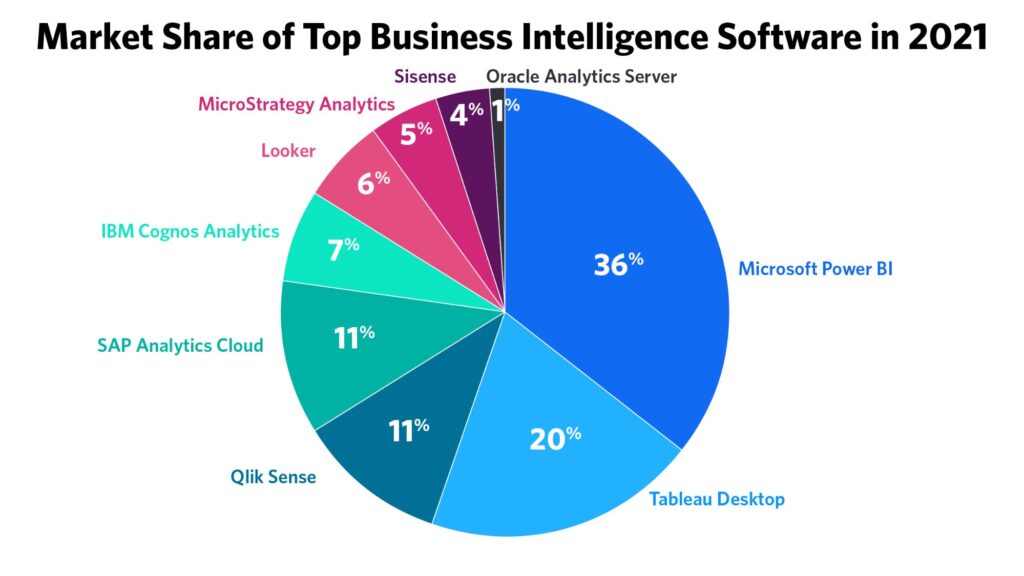
1.12 Power BI vs Tableau vs QlikView
1.13 Introduction to Power BI desktop
1.14 Installation of Power BI desktop
1.15 The key features of Power BI workflow
1.16 Process of creating reports in Power BI
Hands-on Exercise –
- Demo of building a Power BI dashboard
- Source data from the web
- Publish to the cloud
- Create power tables
In the second module of this Power BI certification, you will learn the basics of data extraction
2.1 Overview of Power BI desktop
2.2 Data sources in Power BI
2.3 Using files (excel, pdf, csv, etc.) as a data source
2.4 Using SaaS connectors
2.5 Extracting data from folders, and databases
2.6 Working with Azure SQL database and database sources
2.7 Connecting to Analysis Services
2.8 Other data sources (OData, web, SharePoint, etc.)
2.9 Python R script in Power BI
2.10 Introduction of power query editor
2.11 Advance editor
2.12 Query dependency editor
Hands-on Exercise –
- Connect to a database
- Import data from an Excel file
- Connect to SQL server
- Analysis service
- Connect to power query
- Connect to SQL Azure
- Connect to Hadoop
3.1 Shaping data using Power Query Editor
3.2 Formatting data
3.3 Transformation of data
3.4 Understanding of Data types
3.5 Data profiling for data quality check
3.6 Naming conventions and best practices to consider
3.7 Identify and create appropriate keys for joins
3.8 Working with Parameters
3.9 Merge Query
3.10 Append Query
3.11 Group by of data (aggregation of data)
3.12 Applied steps (query settings)
3.13 Duplicate and reference tables
3.14 Transpose of data
3.15 Fill
3.16 Pivot & Un-pivot of data
3.17 Custom columns
3.18 Conditional columns
3.19 Replace data from the tables
3.20 Split columns values
3.21 Move columns and sorting of data
3.22 Detect data type, count rows, and reverse rows
3.23 Promote rows as column headers
3.24 Hierarchies in Power BI
3.25 M query
Hands-on Exercise –
- Install Power BI Desktop and configure the settings
- Use Query Editor
- Write a power query
- Transpose a table
4.1 Introduction to relationships
4.2 Creating relationships
4.3 Cardinality
4.4 Cross-filter direction
4.5 Use of inactive relationships
4.6 Introduction of DAX
4.7 Why is DAX used?
4.8 DAX syntax
4.9 DAX functions
4.10 Context in DAX
4.11 Calculated columns using DAX
4.12 Measures using DAX
4.13 Calculated tables using DAX
4.14 Learning about table, information, logical, text, iterator,
4.15 Time intelligence functions (YTD, QTD, MTD)
4.16 Cumulative values, calculated tables, and ranking and rank over groups
4.17 Date and time functions
4.18 Identify poorly performing measures, relationships, and visuals
4.19 DAX advanced features
Hands-on Exercise –
- Create a Power Pivot Apply filters
- Use advanced functionalities like date and time functions
- Embed Power Pivot in Power BI Desktop
- Create DAX queries for calculating columns, tables, and measures
5.1 Deep dive into Power BI data visualization
5.2 Understanding Power View and Power Map
5.3 Data visualization techniques
5.4 Page layout and formatting
5.5 Power BI Desktop visualization
5.6 Formatting and customizing visuals
5.7 Visualization interaction
5.8 Custom visualization in Power BI
5.9 Top-down and bottom-up analytics
5.10 Drill down
5.11 Drill through
5.12 Page navigations
5.13 Bookmarks
5.14 Selection pane to show/hide visuals
5.15 Comparing volume and value-based analytics
5.16 Combinations charts (dual axis charts)
5.17 Filter pane
5.18 Slicers
5.19 Use of Hierarchies in drill down analysis
5.20 Theme for corporate standards
5.21 Power BI template for design reusability
5.22 Mastering the best practices
5.23 Performance analyzer in Power BI for monitoring performance of report
5.24 Power BI Q&A (Natural Language Query visual)
5.25 Sync slicers
5.26 Tooltips and custom tooltips
5.27 Tables and matrix
5.28 Conditional formatting on visuals
5.29 Waterfall chart, KPI, Donut chart, Scatter chart
5.30 Geographical data visualization using Maps
Hands-on Exercise –
- Create a Power View and a Power Map
- Format and customize visuals
- Deploy Power View on SharePoint and Excel
- Implement top-down and bottom-up analytics
- Create Power View reports, Charts, Scorecards
- Add a custom visual to report
- Authenticate a Power BI web application
- Embed dashboards in applications
- Categorize, filter, and sort data using Power View
- Create hierarchies
- Use date hierarchies
- Use business hierarchies
- Resolve hierarchy issues
6.1 Introduction to Power BI service
6.2 Introduction of workspaces
6.3 Dashboard
6.4 Creating and configuring dashboards
6.5 Dashboard theme
6.6 Reports vs Dashboards
6.7 Building workspace apps
6.8 Sharing reports and dashboards
6.9 configure subscriptions and data alerts
6.10 Paginated report
6.11 Introduction to Power Q & A
6.12 Ask questions about your data using natural query language
6.13 Getting answers in the form of charts, graphs, and data discovery methodologies
6.14 Configure custom questions for Q&A like FAQ
6.15 Ad-hoc analytics building
6.16 Power Q&A best practices
6.17 Quick Insights
6.18 Subscribe, alerts, usage statics, related content
6.19 Design reports on Power BI service
6.20 Collaboration using Power BI service
6.21 Row level security (RLS)
6.22 Introduction of paginated reports
6.23 Introduction of Power BI report server
Hands-on Exercise –
- Write queries using natural language
- Get answers in the form of charts, graphs
- Build ad hoc analytics
- Pin a tile and a range to the dashboard
7.1 Understanding Power BI desktop settings
7.2 Aggregating data from multiple data sources
7.3 Power BI service settings
7.4 Power BI admin portal
7.5 Administration activities
7.6 Power BI usage analysis
7.7 Introduction of Office 365 admin activities
7.8 Introduction of Data Gateway
7.9 Installation and configuration of data gateways
7.10 Scheduling auto data refresh
7.11 Managing groups, row-level security, datasets, reports, and dashboards
7.12 Real-time data analysis using direct connectivity
7.13 Direct query vs import mode
Hands-on Exercise –
- Configure security for dashboard deploy data gateways
- Aggregate data from multiple data sources
- Schedule data refresh
- Manage groups and row-level security, datasets, reports, and dashboards
- Work with calculated measures
8.1 Introduction to Power BI Services
8.2 Introduction to Power BI Mobile
8.3 Creating mobile-based reports and dashboards
8.4 Optimizing report for Power BI mobile app
8.5 Features of Power BI mobile app
8.6 Introduction of integrating Power BI & Excel
8.7 Power Bi Workspaces
8.8 Power Bi Templates
8.9 Power Bi Apps
8.10 Power Bi Storage and Dataflows
8.11 Walthrough on Power Bi Services and the edit Options available
Hands-on Exercise –
- Design Power BI reports for mobile app
- Power BI embedded demo
Coming to the last module of this Power BI certification course, you will learn advanced Power BI and Power BI Premium.
9.1 Introduction to Power BI Premium
9.2 Power BI Premium per user
9.3 Power BI Premium features
9.4 Introduction to Data Flow
9.5 Create data flow
9.6 Advantages of data flow
9.7 Create reports using data flow
9.8 Introduction to Power BI deployment pipelines
9.9 Create deployment pipelines
9.10 Benefits of deployment pipelines
9.11 Introduction of sensitivity labels
9.12 Introduction of Power BI goals feature
9.13 Incremental data load in Power BI
9.14 Use AI visuals
9.15 Use the Forecast feature
9.16 Power BI best practice rules to improve performance
Hands-on Exercise –
- Demo of data flow
- Demo of deployment pipelines
- Demo of incremental load of data in Power BI
Resume Creation along with project delivery and explanation of the projects with proper profile creation covering all the question around the project like name of the reports covered in the program with the KPI’s used and measure built, problem faced and the solution provided by you in the realtime application, Mock interviews will be provided post program to check your skill and make you interview ready.
Interview Preperation for a succesful switch & Non IT to IT will be provided to each candidate One on One.

A Power BI course is suitable for anyone interested in harnessing the power of data for better decision-making. Whether you're a business analyst looking to create impactful visualizations, a data scientist seeking to showcase your insights, or a small business owner wanting to make data-driven choices, Power BI offers valuable skills. With this course, you'll learn to connect to data sources, create compelling reports and dashboards, and gain insights from your data, making it a valuable asset for various professionals and enthusiasts alike.
To begin learning Power BI, having a solid foundation in basic computer skills is essential. You should feel comfortable using a computer, navigating through files and folders, and using web browsers. While not mandatory, familiarity with concepts like data and databases can be helpful. It's also beneficial to have access to Power BI Desktop and the motivation to learn, as gaining proficiency in this tool takes practice and patience. Whether you're a business professional or an aspiring data analyst, starting with introductory courses and gradually advancing as you gain confidence is a practical approach to mastering Power BI.
Taking up a Power BI online course in India offers a host of advantages in today's data-centric world. Firstly, it provides accessibility to high-quality education regardless of your geographical location within India. You can learn from renowned instructors and institutions without the need for travel, making it convenient and cost-effective. Moreover, online courses offer flexibility in terms of scheduling, enabling you to balance your studies with work or other commitments. With the rising demand for data-driven decision-making across industries, Power BI skills are highly marketable. Completing an online Power BI course often comes with certification, bolstering your resume and enhancing your career prospects.

